
Why it matters
VR environments are more and more realistic. To make them more immersive, designers often ask the same question: what do our users actually feel, and does our scene convey the emotion we want?
The stakes are real. Emotion and immersion feed each other: scenes designed to be emotional give users a stronger sense of immersion, and that sense in turn shapes what they feel (Riva et al., 2007). Immersive scenes can trigger emotions that show up in brain and heart signals (Marín-Morales et al., 2018).
Beyond the designers’ intentions, how can we know what users feel? Which tools make this possible?
To answer, we re-analysed an open dataset. It contains two VR scenes designed to trigger two opposite emotions. Did the scenes produce the target emotions? And how can we measure it?
Two scenes, two target emotions
Both scenes target a strong emotion: anger in the subway, joy in the forest (Alonso-Valerdi et al., 2025). Researchers describe an affective state on two axes: valence, which tells whether it is pleasant or unpleasant, and arousal, which tells how activated it is, from calm to excited (Russell, 1980). Anger and joy have the same high arousal. Their valence is opposite.
| Scene | Target emotion | Valence | Arousal | How the scene tries |
|---|---|---|---|---|
| Subway | Anger | Unpleasant | High | Dim light; a virtual avatar recounts an unfair experience on public transport |
| Forest | Joy | Pleasant | High | Bright light; the same virtual avatar shares a happy family memory |
How to measure it
Each participant sees both scenes
2 min break
6 participants lived both scenes in a VR headset, 3 minutes each, after 2 minutes of rest.
| Level | Tool in the study | What it indicates |
|---|---|---|
| Subjective | Self-Assessment Manikin (SAM) questionnaire after each scene (Bradley & Lang, 1994) | Valence, arousal and the emotion perceived in the virtual avatar |
| Body | Electrodermal activity (EDA) | Whether the body activated: EDA measures sweat on the skin, which follows the activation of the nervous system (Boucsein, 2012) |
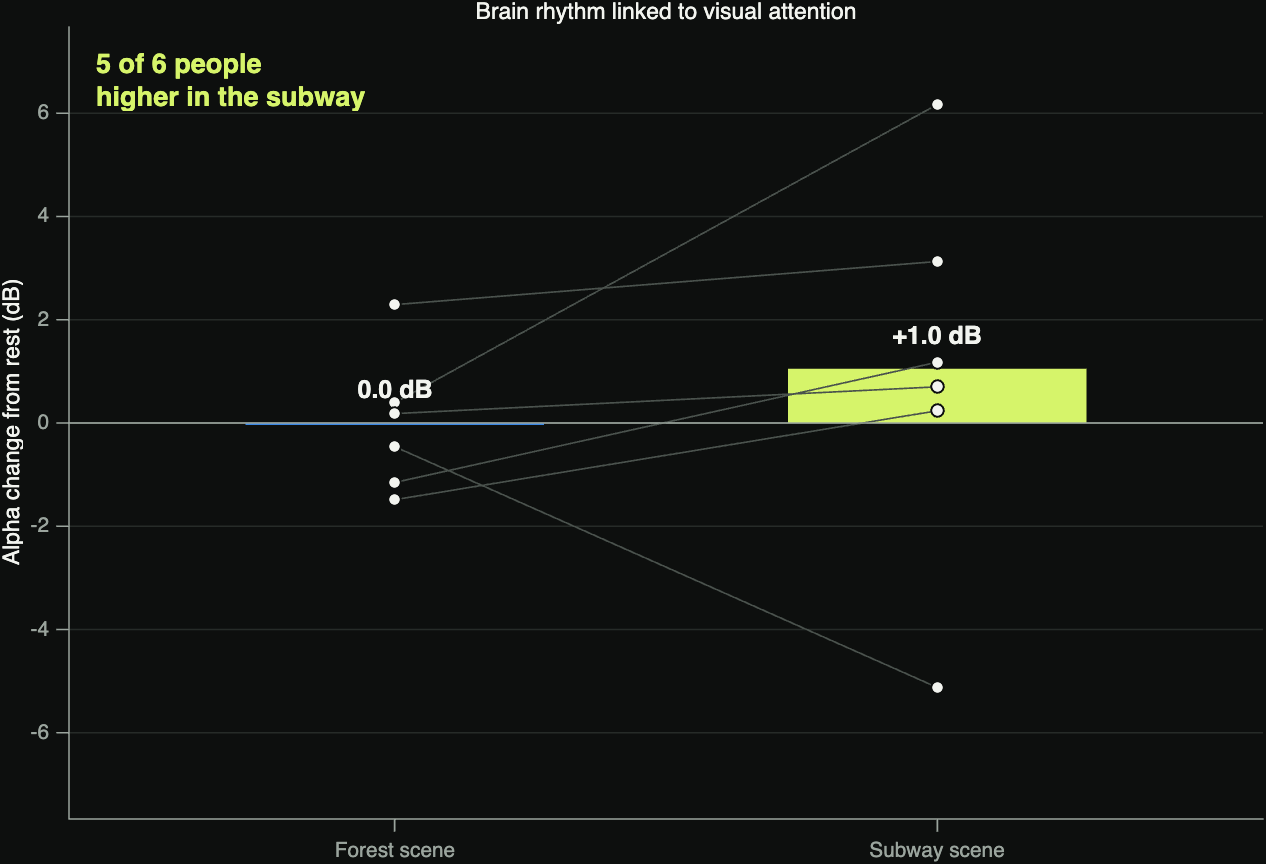
| Brain | Electroencephalography (EEG), 8-channel headset | How brain activity changed: EEG measures the brain’s electrical activity with electrodes placed on the head. We looked at the alpha rhythm, a regular oscillation of this activity, at the back of the head. It increases when the brain reduces the attention it gives to what we see |
We speak of a reaction when the signal during the scene clearly departs from the same participant’s signal at rest. Each participant is thus their own reference.
What we found
In this sample of 6 participants, the subway scene produced the intended effect: it was rated unpleasant, and the body and brain reacted. The forest scene was rated pleasant but calm, although it was designed to be exciting and to produce intense joy.
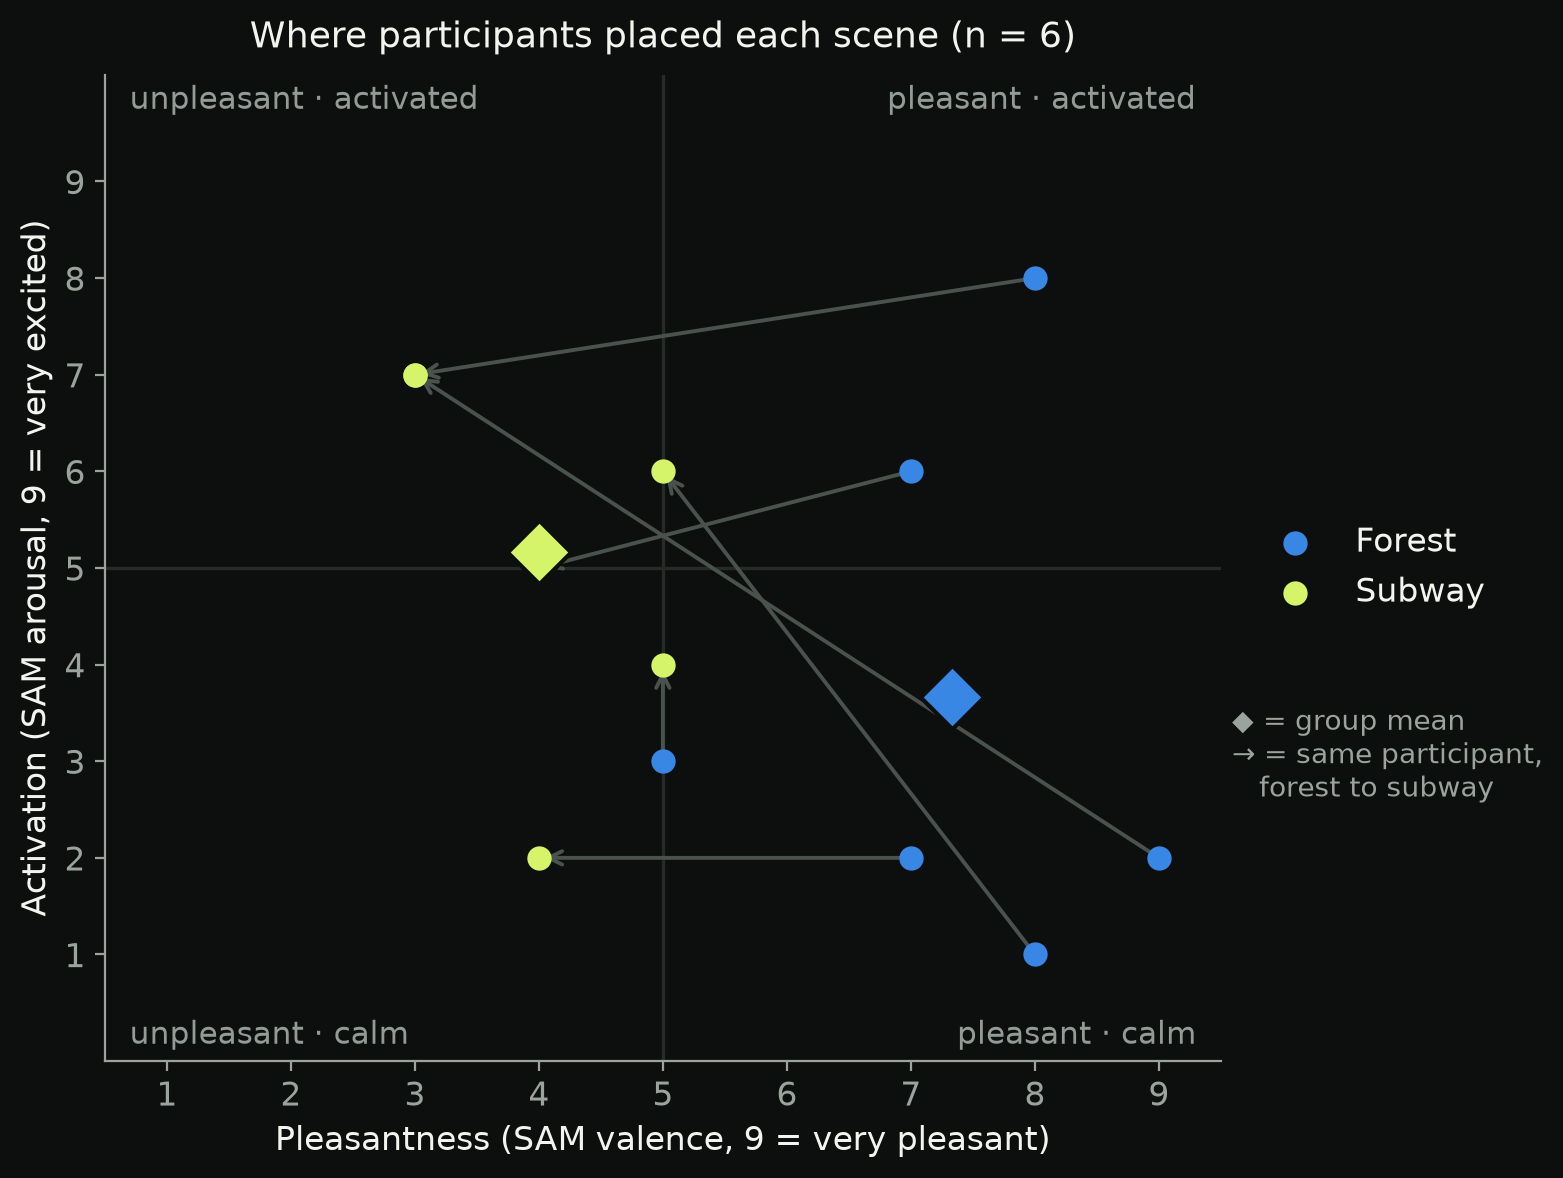
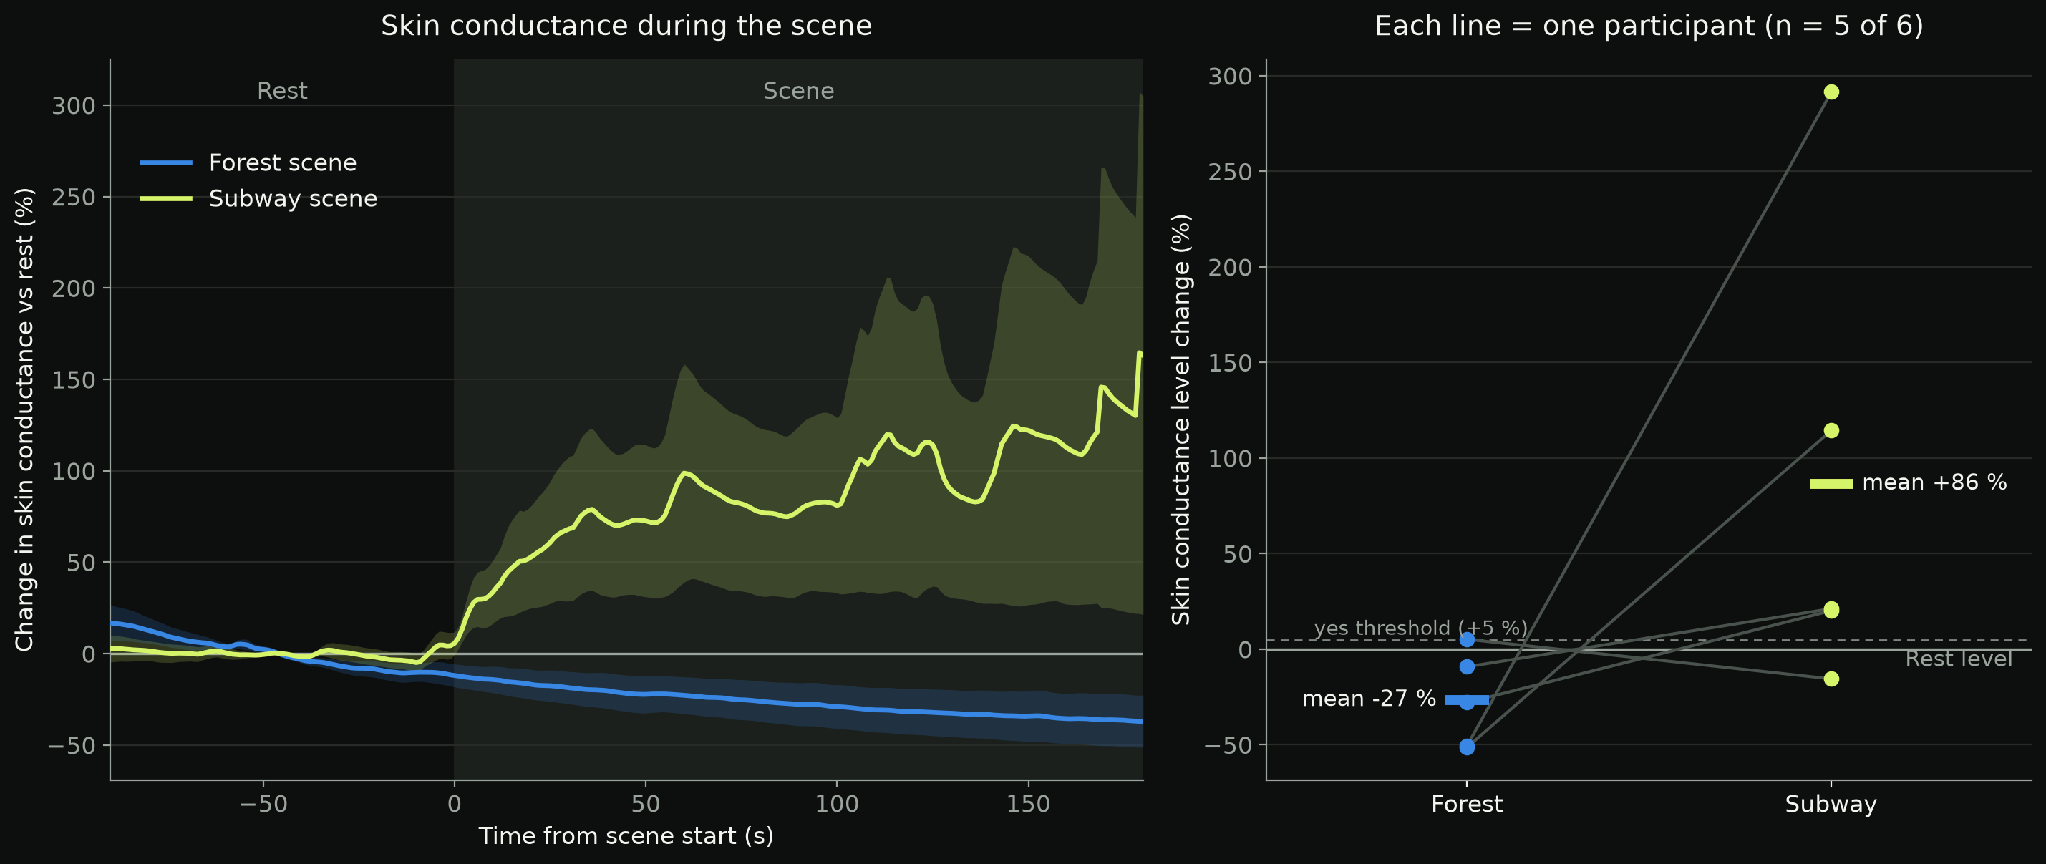
- Subway: intended effect reached. 4 of 6 participants found it unpleasant. In 4 of the 5 participants with a usable sensor, EDA rose from the start of the scene.
- Forest: pleasant, but not joyful. 5 of 6 participants found it pleasant and 4 of 6 found it calm. EDA rose in only 1 of 5 participants. The forest did not produce the high arousal of the intended joy.
- Brain: less attention to the image in the subway? The alpha rhythm increases when the brain reduces its visual attention (Jensen & Mazaheri, 2010). This is consistent with attention going to the virtual avatar’s voice rather than to the image.
- The questionnaire and the sensors do not say the same thing. Each measure brings information the other does not.
What it means for you
This is a case study. It shows several things:
- Study how your users feel, don’t assume it. A scene designed for joy produced calm. A short pilot shows the real effect of your scene before you deploy it.
- Combine the questionnaire and the sensors.
- Test your virtual avatar’s expressions. An emotion that looks obvious to the designer can be misidentified by users.
- We can test your scenes with a suitable pilot and measures suited to your question.
Data and credit
Data: Ramirez-Lechuga, Alonso-Valerdi & Ibarra-Zarate (2023), Tecnológico de Monterrey, Mendeley Data, doi:10.17632/y76vbw92y9.3, CC BY 4.0. Independently re-analysed by Nox Science: the selection of participants, the processing and the statistics are ours, and the dataset’s authors were not involved. Demonstration on open data: 6 participants, scenes always shown in the same order.
References
- Riva, G., Mantovani, F., Capideville, C. S., Preziosa, A., Morganti, F., Villani, D., Gaggioli, A., Botella, C. & Alcañiz, M. (2007). Affective interactions using virtual reality: the link between presence and emotions. CyberPsychology & Behavior, 10(1), 45–56. doi:10.1089/cpb.2006.9993
- Marín-Morales, J., Higuera-Trujillo, J. L., Greco, A., Guixeres, J., Llinares, C., Scilingo, E. P., Alcañiz, M. & Valenza, G. (2018). Affective computing in virtual reality: emotion recognition from brain and heartbeat dynamics using wearable sensors. Scientific Reports, 8, 13657. doi:10.1038/s41598-018-32063-4
- Russell, J. A. (1980). A circumplex model of affect. Journal of Personality and Social Psychology, 39(6), 1161–1178. doi:10.1037/h0077714
- Bradley, M. M. & Lang, P. J. (1994). Measuring emotion: the Self-Assessment Manikin and the semantic differential. Journal of Behavior Therapy and Experimental Psychiatry, 25(1), 49–59. doi:10.1016/0005-7916(94)90063-9
- Boucsein, W. (2012). Electrodermal Activity (2nd ed.). Springer. doi:10.1007/978-1-4614-1126-0
- Jensen, O. & Mazaheri, A. (2010). Shaping functional architecture by oscillatory alpha activity: gating by inhibition. Frontiers in Human Neuroscience, 4, 186. doi:10.3389/fnhum.2010.00186
- Alonso-Valerdi, L. M., Ramirez-Lechuga, S. & Ibarra-Zarate, D. I. (2025). Audiovisual virtual reality for emotion induction: a dataset of physiological responses. Scientific Data, 12, 1387. doi:10.1038/s41597-025-05691-5