
Why driver fatigue is a critical phenomenon
Driving is one of the riskiest everyday activities. In Europe, in-depth crash investigations attribute 10% to 24% of crashes to fatigue (European Road Safety Observatory).
Long, monotonous drives make it worse. A straight, quiet highway demands vigilance but offers little stimulation: attention drifts and drowsiness sets in (Thiffault & Bergeron, 2003). Drivers do not always notice.
That is why many carmakers and manufacturers try to measure, detect and, if possible, predict driver fatigue. Depending on the studies and projects, different signals are used to estimate it: the eyes, the heart, the breathing, the way the car is driven. So which signal is the most reliable?
To answer, we compared these signals on an open dataset. In this dataset, a sleep physician rated each driver’s fatigue from brain activity. This rating is our reference.
What can be measured
Five families of signals are frequently used to measure fatigue at the wheel.
| Signal | Sensor in the cabin |
|---|---|
| Driving (steering, lane keeping) | Included in the vehicle |
| Eyes (blinks, eye movements, PERCLOS*) | Driver-facing camera |
| Heart | Steering wheel, seat, wristband |
| Breathing | Seat, seat belt |
| Brain (EEG) | Headset |
* PERCLOS: share of time the eyes are at least 80% closed, measured over a minute or more. It is the long-standing reference for camera-based drowsiness detection: a US federal evaluation found it the most reliable of the drowsiness measures it tested (FHWA, 1998).
The reference
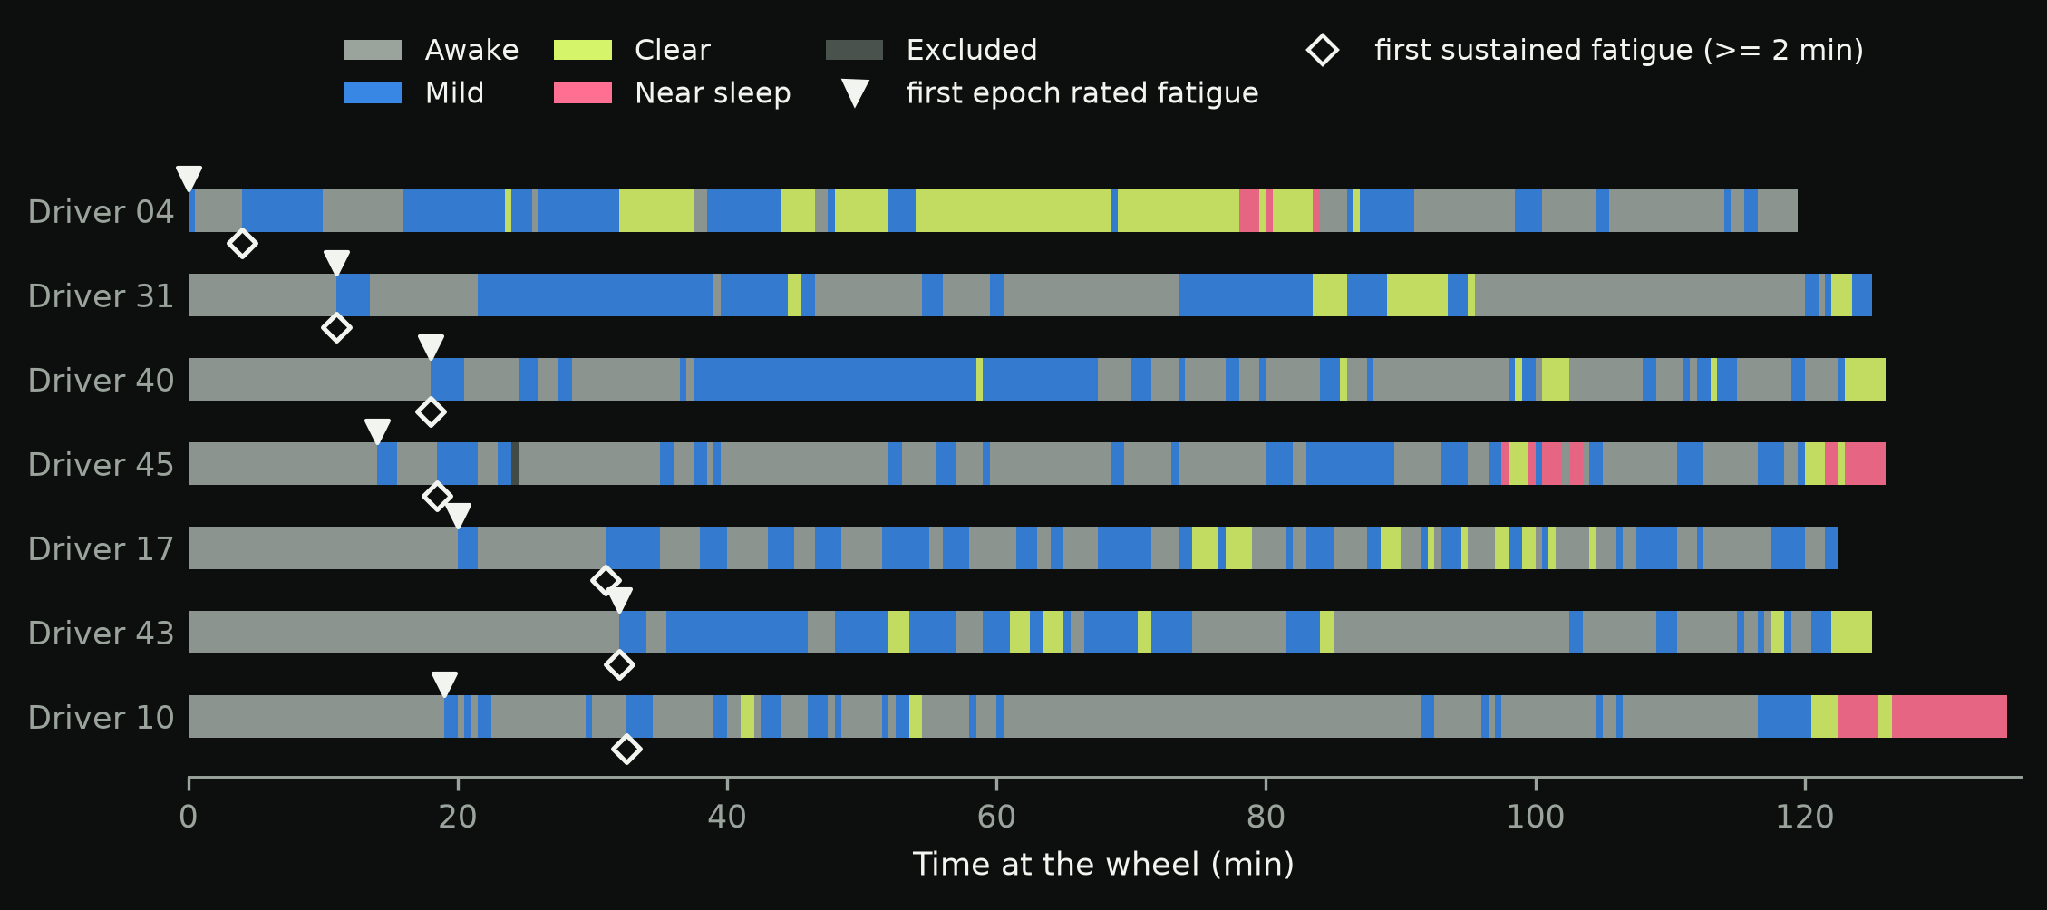
To evaluate a sensor, you need to know when the driver is really tired. Drivers can be asked, but their judgement of their own fatigue is subjective. Here, a sleep physician rated each driver’s brain activity (EEG) every 30 seconds. They classified the driver’s state on five levels, from fully awake to light sleep. This rating is the reference for every other signal.
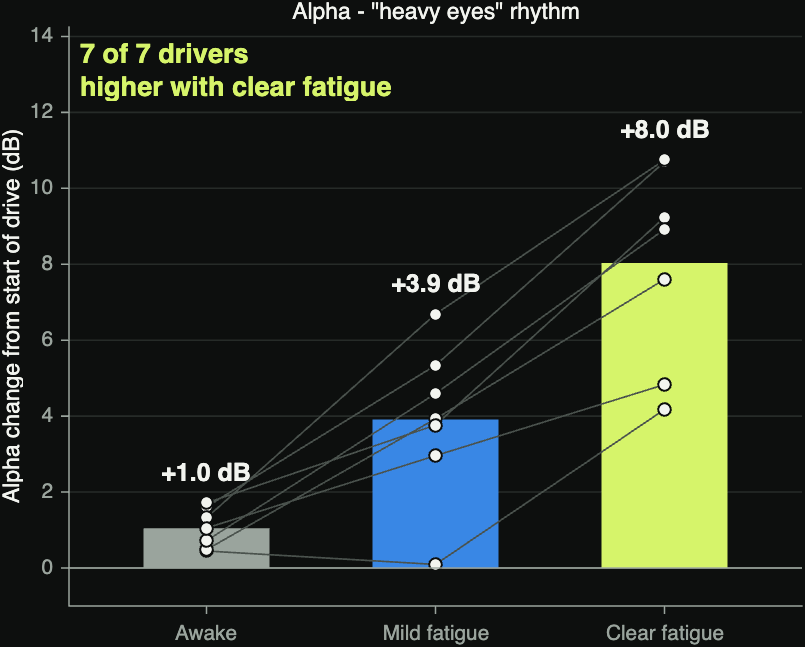
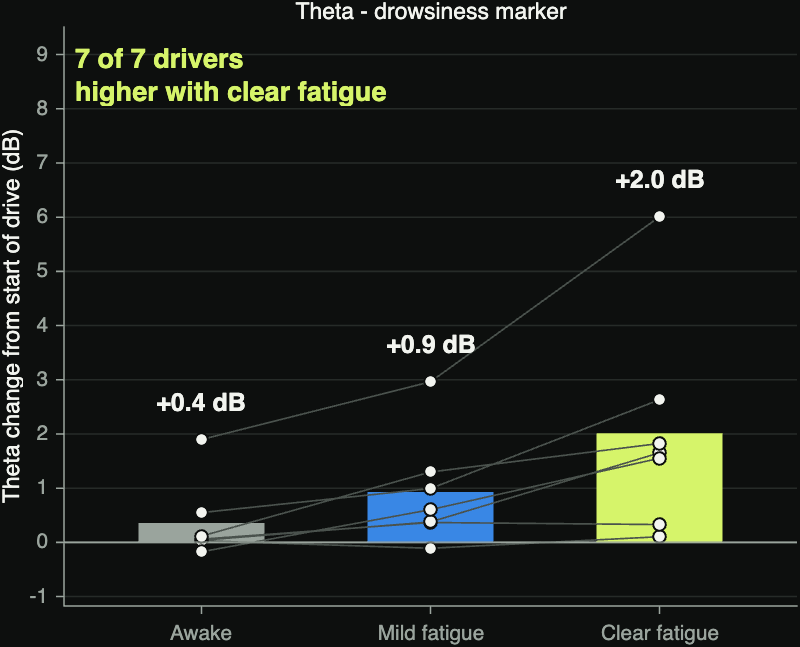
EEG records the brain’s electrical activity. This activity forms rhythms, that is, regular oscillations. Two rhythms increased with fatigue in all 7 drivers:
- The alpha rhythm, measured at the back of the head. It increases when the brain processes less of what we see. It is about 6 times stronger in clear fatigue than at the start of the drive.
- The theta rhythm, measured at the front of the head. It is associated with drowsiness. It is about 60% stronger in clear fatigue than at the start of the drive.
Measured data
Seven adults drove a monotonous highway simulation for 2 hours. Their brain activity, eyes, heart and breathing were recorded. These 7 drivers come from the 50 in the dataset: we kept those who became clearly tired and started the drive awake. Each driver is compared with their own first minutes at the wheel. One driver who stayed alert throughout served as a control: it checks that the signals do not simply change with time spent seated.
| Measure | Tool in the study | What it stands for in a car |
|---|---|---|
| Fatigue level | Sleep physician, EEG rating every 30 s | The reference |
| Brain | 32-channel EEG | Lab reference only |
| Eyes | Electrodes around the eyes (EOG) | What a driver camera sees |
| Heart | ECG | Steering wheel, seat or wristband |
| Breathing | Chest belt | Seat or seat-belt sensor |
We consider that a signal tracks a driver’s fatigue when it clearly separates their awake moments from their tired ones.
What we found
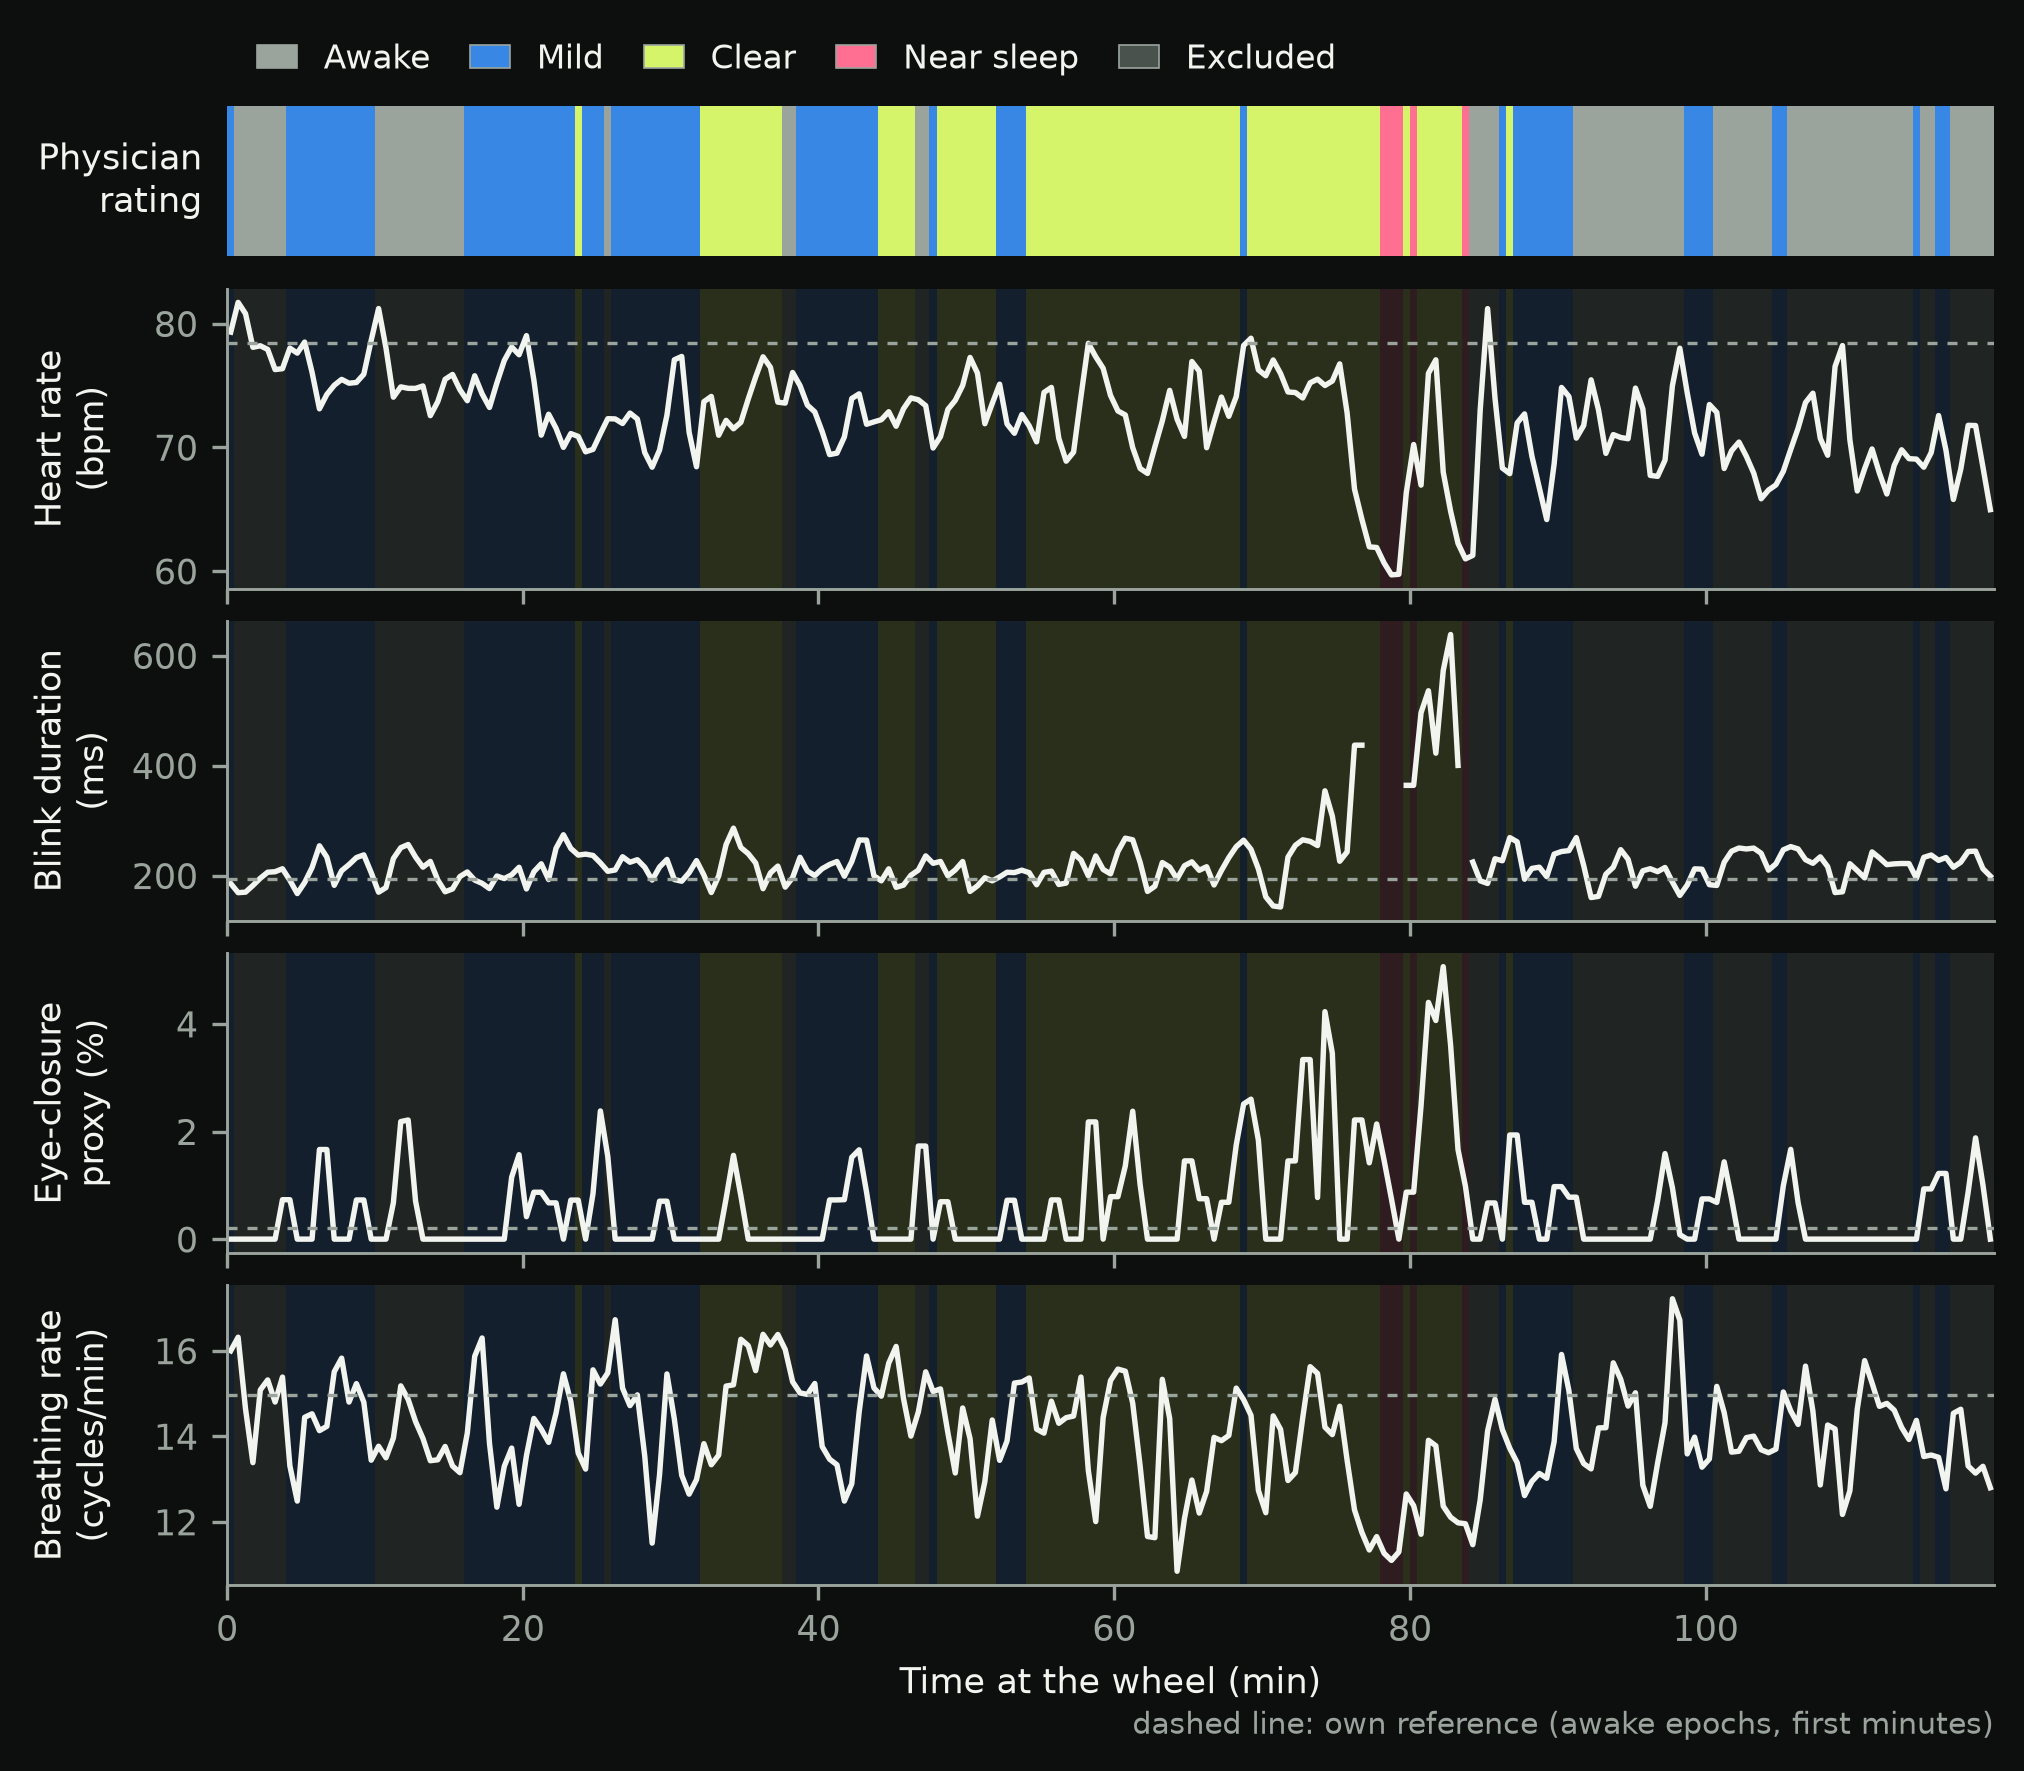
The eyes are the most consistent signal: they tracked fatigue in 6 of 7 drivers. The heart is weaker (5 of 7) and breathing weaker still (3 of 7).
| Signal | Indicator | Tracks fatigue (of 7) | Change in clear fatigue |
|---|---|---|---|
| Eyes | Blinks and quick eye movements | 6 | −61% (rarer) |
| Eyes | Blink duration | 4 | +27% (+100% near sleep) |
| Heart | Heart rate | 5 | −5% |
| Breathing | Breathing rate | 3 | −10% |
| Eyes | PERCLOS measured with electrodes | 1 | inconsistent |
Changes: median across drivers. The other indicators tested (slow eye movements, heart and breathing variability) tracked fatigue in 2 to 4 drivers. The ranking is the same when comparing awake and tired moments from the same part of the drive.
- Eyes: a fixed stare. Tired drivers blink and move their eyes less. Close to sleep, a blink lasts twice as long, in line with earlier work (Schleicher et al., 2008).
- PERCLOS needs a camera. Measured with electrodes, it tracked fatigue in only 1 driver of 7: long closures are rare.
- Heart: a weak signal. Heart rate falls by about 5% in clear fatigue. It also fell in the driver who stayed alert: time spent seated contributes.
- No early warning. No signal moved before the physician’s rating. They confirm fatigue; they do not anticipate it.
What it means for you
This study, run on 7 drivers in a simulator, offers leads to test on your own data.
- Rely on several signals. Fatigue shows up in the eyes, the heart and the breathing, but these signals vary with the context and the driver.
- Start with the eyes. Fewer blinks and eye movements tracked fatigue more often than eyelid closure did.
- Use the heart as a complement. Its change is small and partly driven by time spent seated. Combined with the eyes, it can add a second opinion.
- Combine several sensors if possible. This may improve detection reliability.
Data and credit
Data: Li, Fu, Tang, Zhou, Chen, Zhou, Chen & Luo (2026), Multimodal Phenotyping Dataset of Driving Fatigue (MPD-DF), Scientific Data 13:289, doi:10.1038/s41597-026-06634-4, CC BY 4.0. Independently re-analysed by Nox Science: the selection of drivers, the processing and the statistics are ours, and the dataset’s authors were not involved. Demonstration on open data: 7 drivers, simulator, ratings by a single physician.
References
- European Road Safety Observatory. Fatigue: frequency of fatigue-related crashes. European Commission. Link
- Thiffault, P. & Bergeron, J. (2003). Monotony of road environment and driver fatigue: a simulator study. Accident Analysis & Prevention, 35(3), 381–391. Summarised by the European Road Safety Observatory
- Federal Highway Administration (1998). PERCLOS: a valid psychophysiological measure of alertness as assessed by psychomotor vigilance. Tech Brief FHWA-MCRT-98-006. Link
- Schleicher, R., Galley, N., Briest, S. & Galley, L. (2008). Blinks and saccades as indicators of fatigue in sleepiness warnings: looking tired? Ergonomics, 51(7), 982–1010. doi:10.1080/00140130701817062
- Li, J. et al. (2026). Multimodal Phenotyping Dataset of Driving Fatigue. Scientific Data, 13, 289. doi:10.1038/s41597-026-06634-4